
Methodology
In plain terms: satellites measure how hot each square kilometre of Mumbai's surface gets in the dry season, how green it is and how much of it is paved. Open data adds how many people live there and how far the nearest hospital is. Those five factors, all from free and open global sources, combine into one vulnerability score per ward, and a set of rules turns each score into a candidate intervention with its reasoning. The steps below document the process and its limits.
UCIP is a citable, versioned heat vulnerability index, not a forecast or a warning service. It covers the 24 wards in the BMC boundary file it was built on, on a 1 km grid. BMC has since split K/E (the K North ward office opened in 2026) and reportedly P North, and no open boundary file for the new wards exists yet, so the index still uses 24. The pipeline runs from a per-city config, but no second city has been run end to end.
Data vintage
Refreshed 17 Oct 2026. The underlying measurements come from Landsat imagery captured 1 Nov 2025 to 28 Feb 2026, Mumbai's most recent complete dry season. The refresh date alone overstates how current the figures are.
What we measure
5 indicators, each z-scored, all from free open global data.
| Indicator | Direction | Source |
|---|---|---|
| Land surface temperature | + (higher = more vulnerable) | Landsat 8/9, USGS, public domain |
| Green cover (NDVI) | - (higher = less vulnerable) | Landsat 8/9, USGS, public domain |
| Population density | + | WorldPop 2020, CC BY 4.0 |
| Hospital distance | + | OpenStreetMap, ODbL |
| Impervious / built-up % | + | ESA WorldCover 2021, CC BY 4.0 |
Direction set per the heat-vulnerability literature (see step 5).
Not scored: the slum share (Datameet slum-cluster polygons) and the under-7 share (Census 2011 ward tables). Both used to be in the index. They were taken out on 17 Oct 2026 because neither exists for most cities or gets updated: the slum polygons are a one-off digitisation and the Census is fifteen years old. They are still published per cell as context, so the index no longer measures informal housing or age directly.
How the score is built
Weighted sum, rescaled 0-100, no black box.
Weights are the absolute first-principal-component loadings of Mumbai's own standardised cells, renormalised to sum to one, following the method of Reid et al. 2009. They come from this run's data, not from judgement. HVI = weighted sum, rescaled 0-100. Explainability is the per-factor contribution (weight × z-score), shown as a ranked bar breakdown per ward on the dashboard. Transparent linear index, no SHAP: nothing black-box to explain.
PC1 explained variance: 73.1% (above 30% floor: PCA weights used directly)
Hospital distance runs against the other indicators on the first component: in Mumbai the hot, dense, paved cells tend to sit close to hospitals. The index keeps the literature's direction (farther from a hospital is more vulnerable) and takes the weight from the size of the loading. That is a judgement, and an open question for review.
Does it hold up
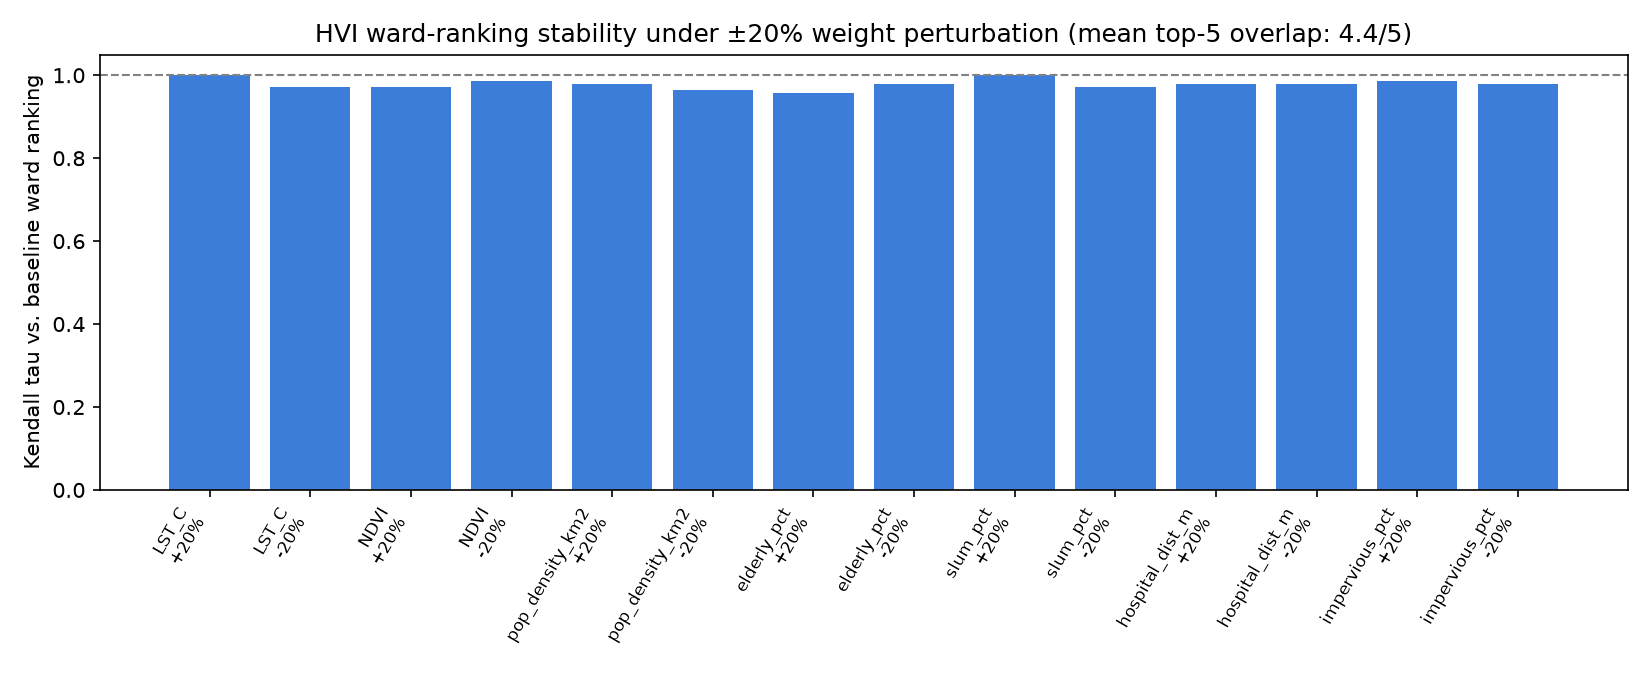
Does the ranking survive a wobble in its own weights?
Weights perturbed ±20% one-at-a-time (10 runs); ward priority ranking measured for stability.
Mean Kendall tau vs. baseline ranking: 0.985. Mean top-5 overlap: 4.8/5. The top five changed in at least one run, so treat the exact order as uncertain.
Checked against ground weather stations
The sensitivity test above asks whether the index is robust to its own weighting. This asks something different and harder: does the satellite temperature layer track the real world at all? Per-overpass Landsat land surface temperature was correlated against daily observations from the two NOAA GSOD weather stations in Mumbai, over 2024-11-01 to 2025-02-28.
| Station | Overpasses | Correlation | LST − air |
|---|---|---|---|
| Santacruz (Chhatrapati Shivaji Maharaj Intl) (inland) | 12 | r = 0.72 | +13.9 C |
| Colaba (coastal) | 11 | r = 0.80 | +3.4 C |
Read this carefully. Land surface temperature is not air temperature: LST is the radiometric temperature of the ground seen from orbit, a station measures shaded air about 1.5 m up. The large positive offset is expected physics, not error, and it is much bigger at inland Santacruz, which sits over airport tarmac, than at coastal Colaba. That spread (3.4 to 13.9 C) is also why no single correction turns this layer into air temperature, and why the index uses it as a relative indicator rather than as a temperature.
What the correlation shows is that the satellite tracks day-to-day thermal variation at a fixed place (pooled within-station r = 0.72, n = 23), rather than reporting sensor noise or cloud artefacts. That is what the ward ranking rests on.
Stated plainly: this validates the method on the most recent dry season where both satellite and station data exist, not the window the published index is computed from. NOAA GSOD publishes on a lag and had no records overlapping the current composite. Two stations is also few, and it is all Mumbai has with a long record.
What to build
Rule-based nature-based-solutions engine, ecologically gated.
Rule-based; each fired rule carries a rationale and a citation. An ecological plantability filter restricts native-tree recommendations to restoration-suitable cells that are not native grassland or savanna (Bastin et al. 2019 potential vs. Veldman et al. 2019 constraint). Cells that would otherwise get trees but fail this check are routed to cool roofs, reflective pavements, or cooling centres instead. In Mumbai the tree rule currently fires on no cell, because every hot, bare cell is already built up. See the "Plantability" layer on the dashboard, or estimate the effect of either intervention directly on the what-if page.
Every source
The papers behind the method, the filter and the cooling coefficients.
- DOI
Reid et al. 2009
Environ. Health Perspect. 117(11):1730-1736
PCA-derived HVI weights (data, not guesses)
- DOI
Azhar et al. 2017 (RAND India HVI)
IJERPH 14(4):357
India-wide district HVI precedent; UCIP goes ward-level
- DOI
Bastin et al. 2019
Science 365(6448):76-79
Global canopy restoration potential; where trees can go
- DOI
Veldman et al. 2019
Science 366(6463):eaay7976
Don't afforest grasslands or savannas; powers the plantability filter
- DOI
Friedlingstein et al. 2019
Science 366(6463):eaay8060
Restoration estimate is inconsistent with carbon-cycle dynamics; trees are not a substitute for cutting emissions
- DOI
Lewis et al. 2019
Science 366(6463):eaaz0388
Regrowth mostly replaces previously-lost carbon, not new sequestration
- DOI
Ziter et al. 2019
PNAS 116(15):7575-7580
Canopy percent to LST reduction coefficients (simulator and NBS impact)
- DOI
Li, Bou-Zeid & Oppenheimer 2014
Environ. Res. Lett. 9(5):055002
Cool-roof fraction to UHI reduction, structural support for a linear term
- DOI
Santamouris 2014
Solar Energy 103:682-703
Albedo to peak-temperature coefficient (~0.6-2.3K per +0.1 albedo)
- DOI
Bowler et al. 2010
Landscape and Urban Planning 97:147-155
Park cool-island effect (~0.94C average daytime, meta-analysis) for the pocket-park simulator term
Limitations, stated openly
What this tool doesn't know.
- Land-surface temperature is not air temperature, and it is daytime only. There is no night-time data, and night heat is what harms people most.
- Ranks are uncertain. A bootstrap over the cells gives most wards a plausible range several places wide, so the exact order should not be quoted on its own.
- Cooling coefficients are transferred from other cities, not Mumbai-calibrated.
- Population density is a WorldPop 2020 model (the most recent year available for India), not a census count.
- Informal housing and age are not scored (see step 1), so wards with a large informal population may be under-ranked relative to their real vulnerability.
- The boundary file has 24 wards. BMC's newer wards (K North, and reportedly a split of P North) are not reflected.
- The what-if estimator is a first-order estimate, not a validated climate model.
- The ecological plantability layer is coarse-resolution.